Matplotlib
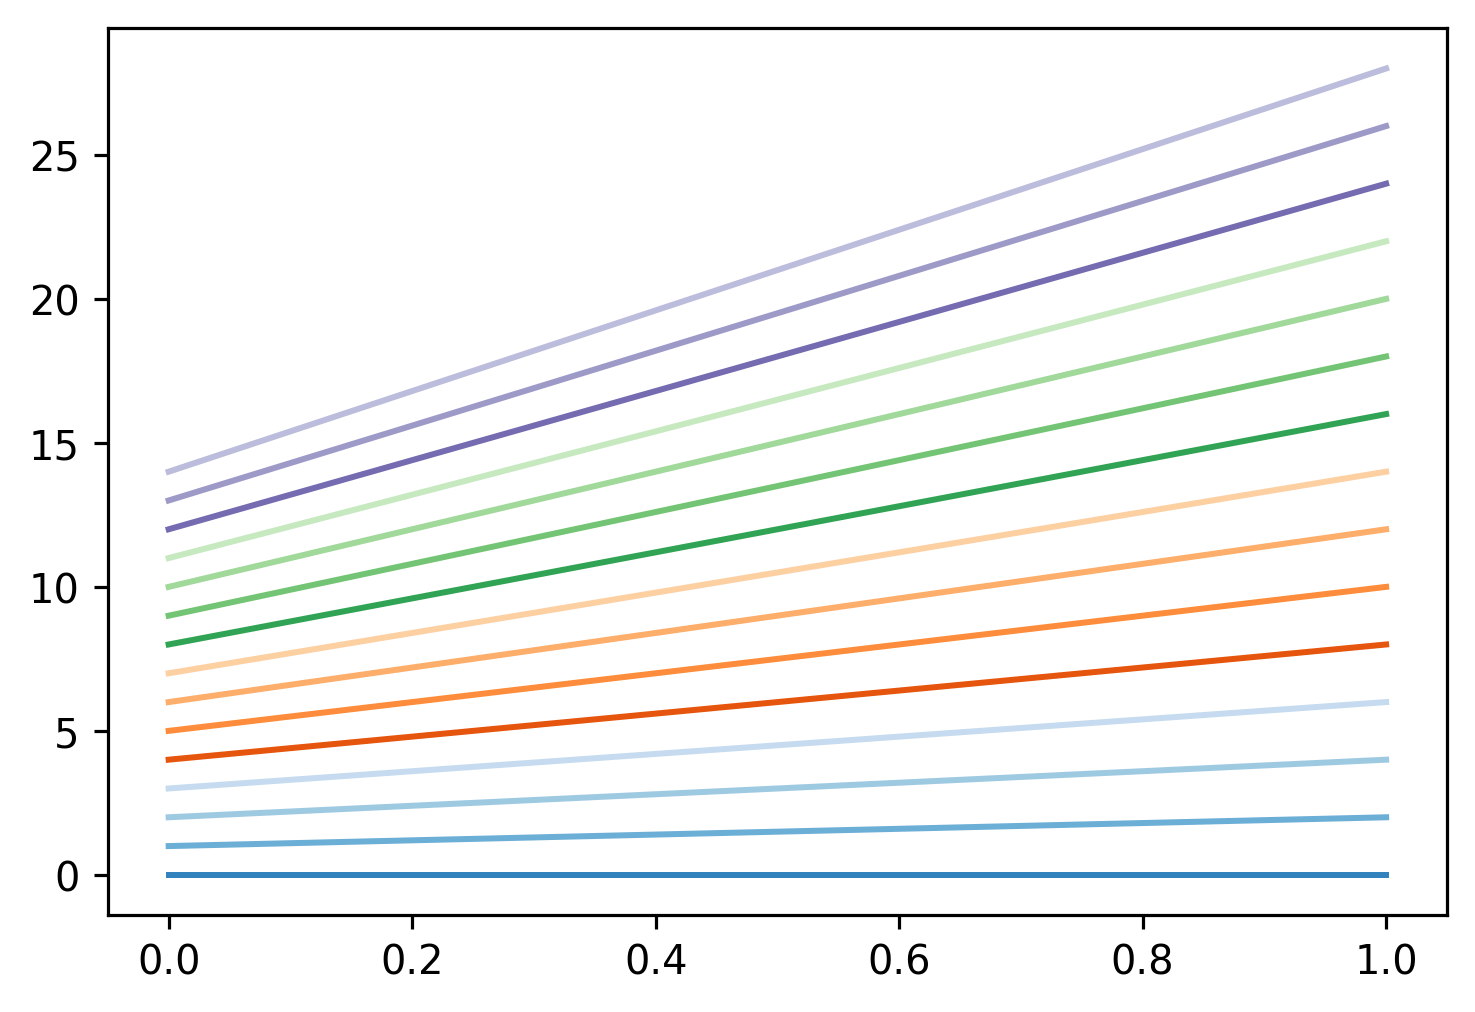
Colors and Color Maps in Matplotlib
Setting colors, color cycles, and colormaps in Matplotlib
Setting colors, color cycles, and colormaps in Matplotlib
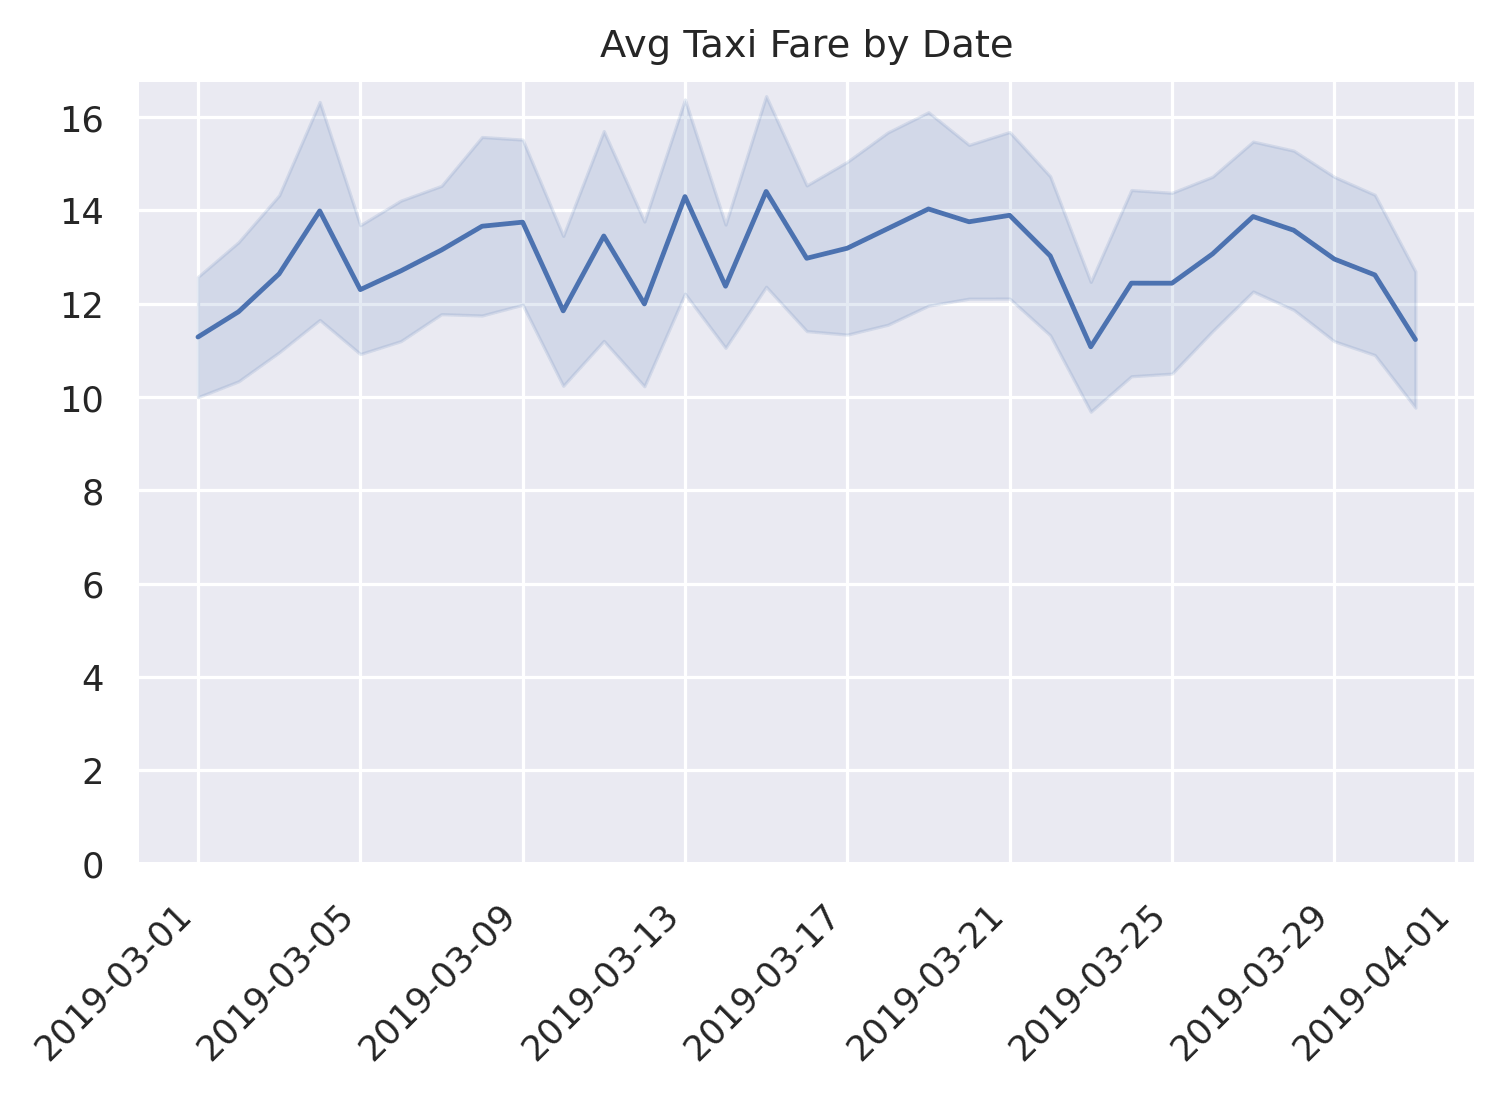
Using Matplotlib, Seaborn, Altair and Plotly to create a line chart with a confidence interval
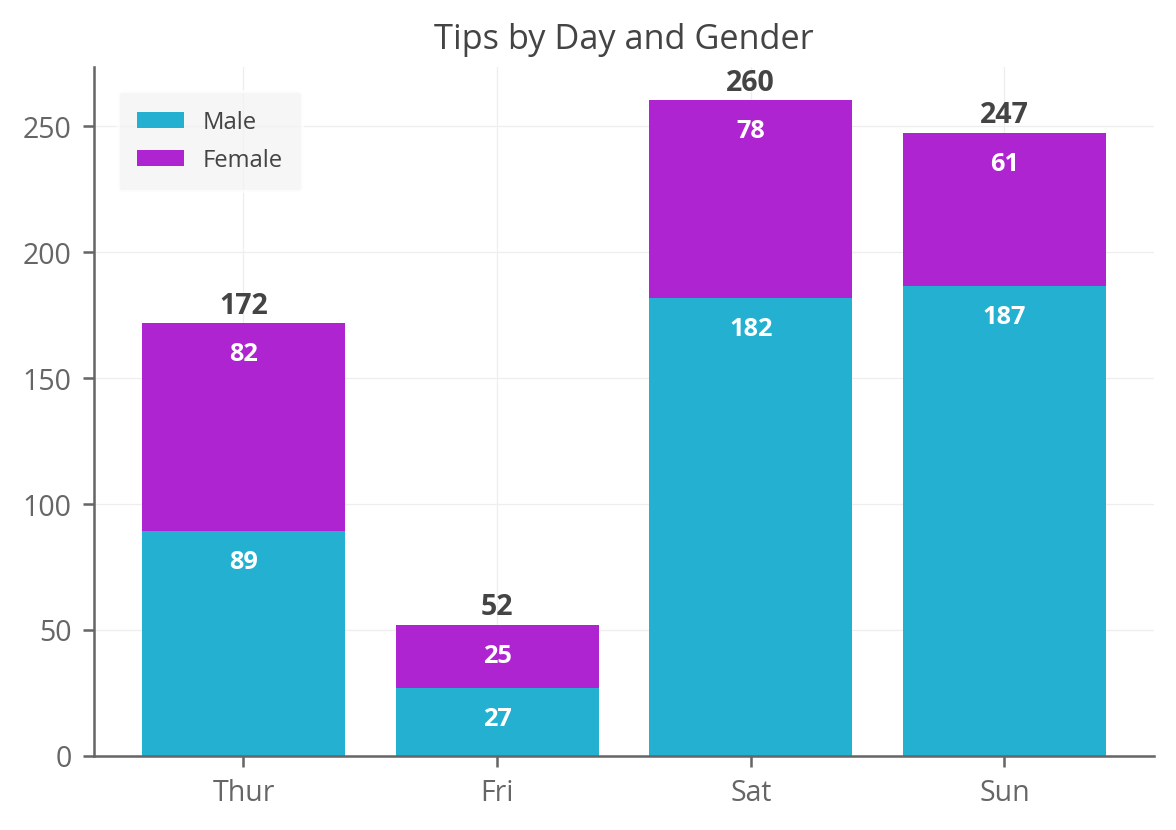
Plotting stacked bar charts with labels in Matplotlib
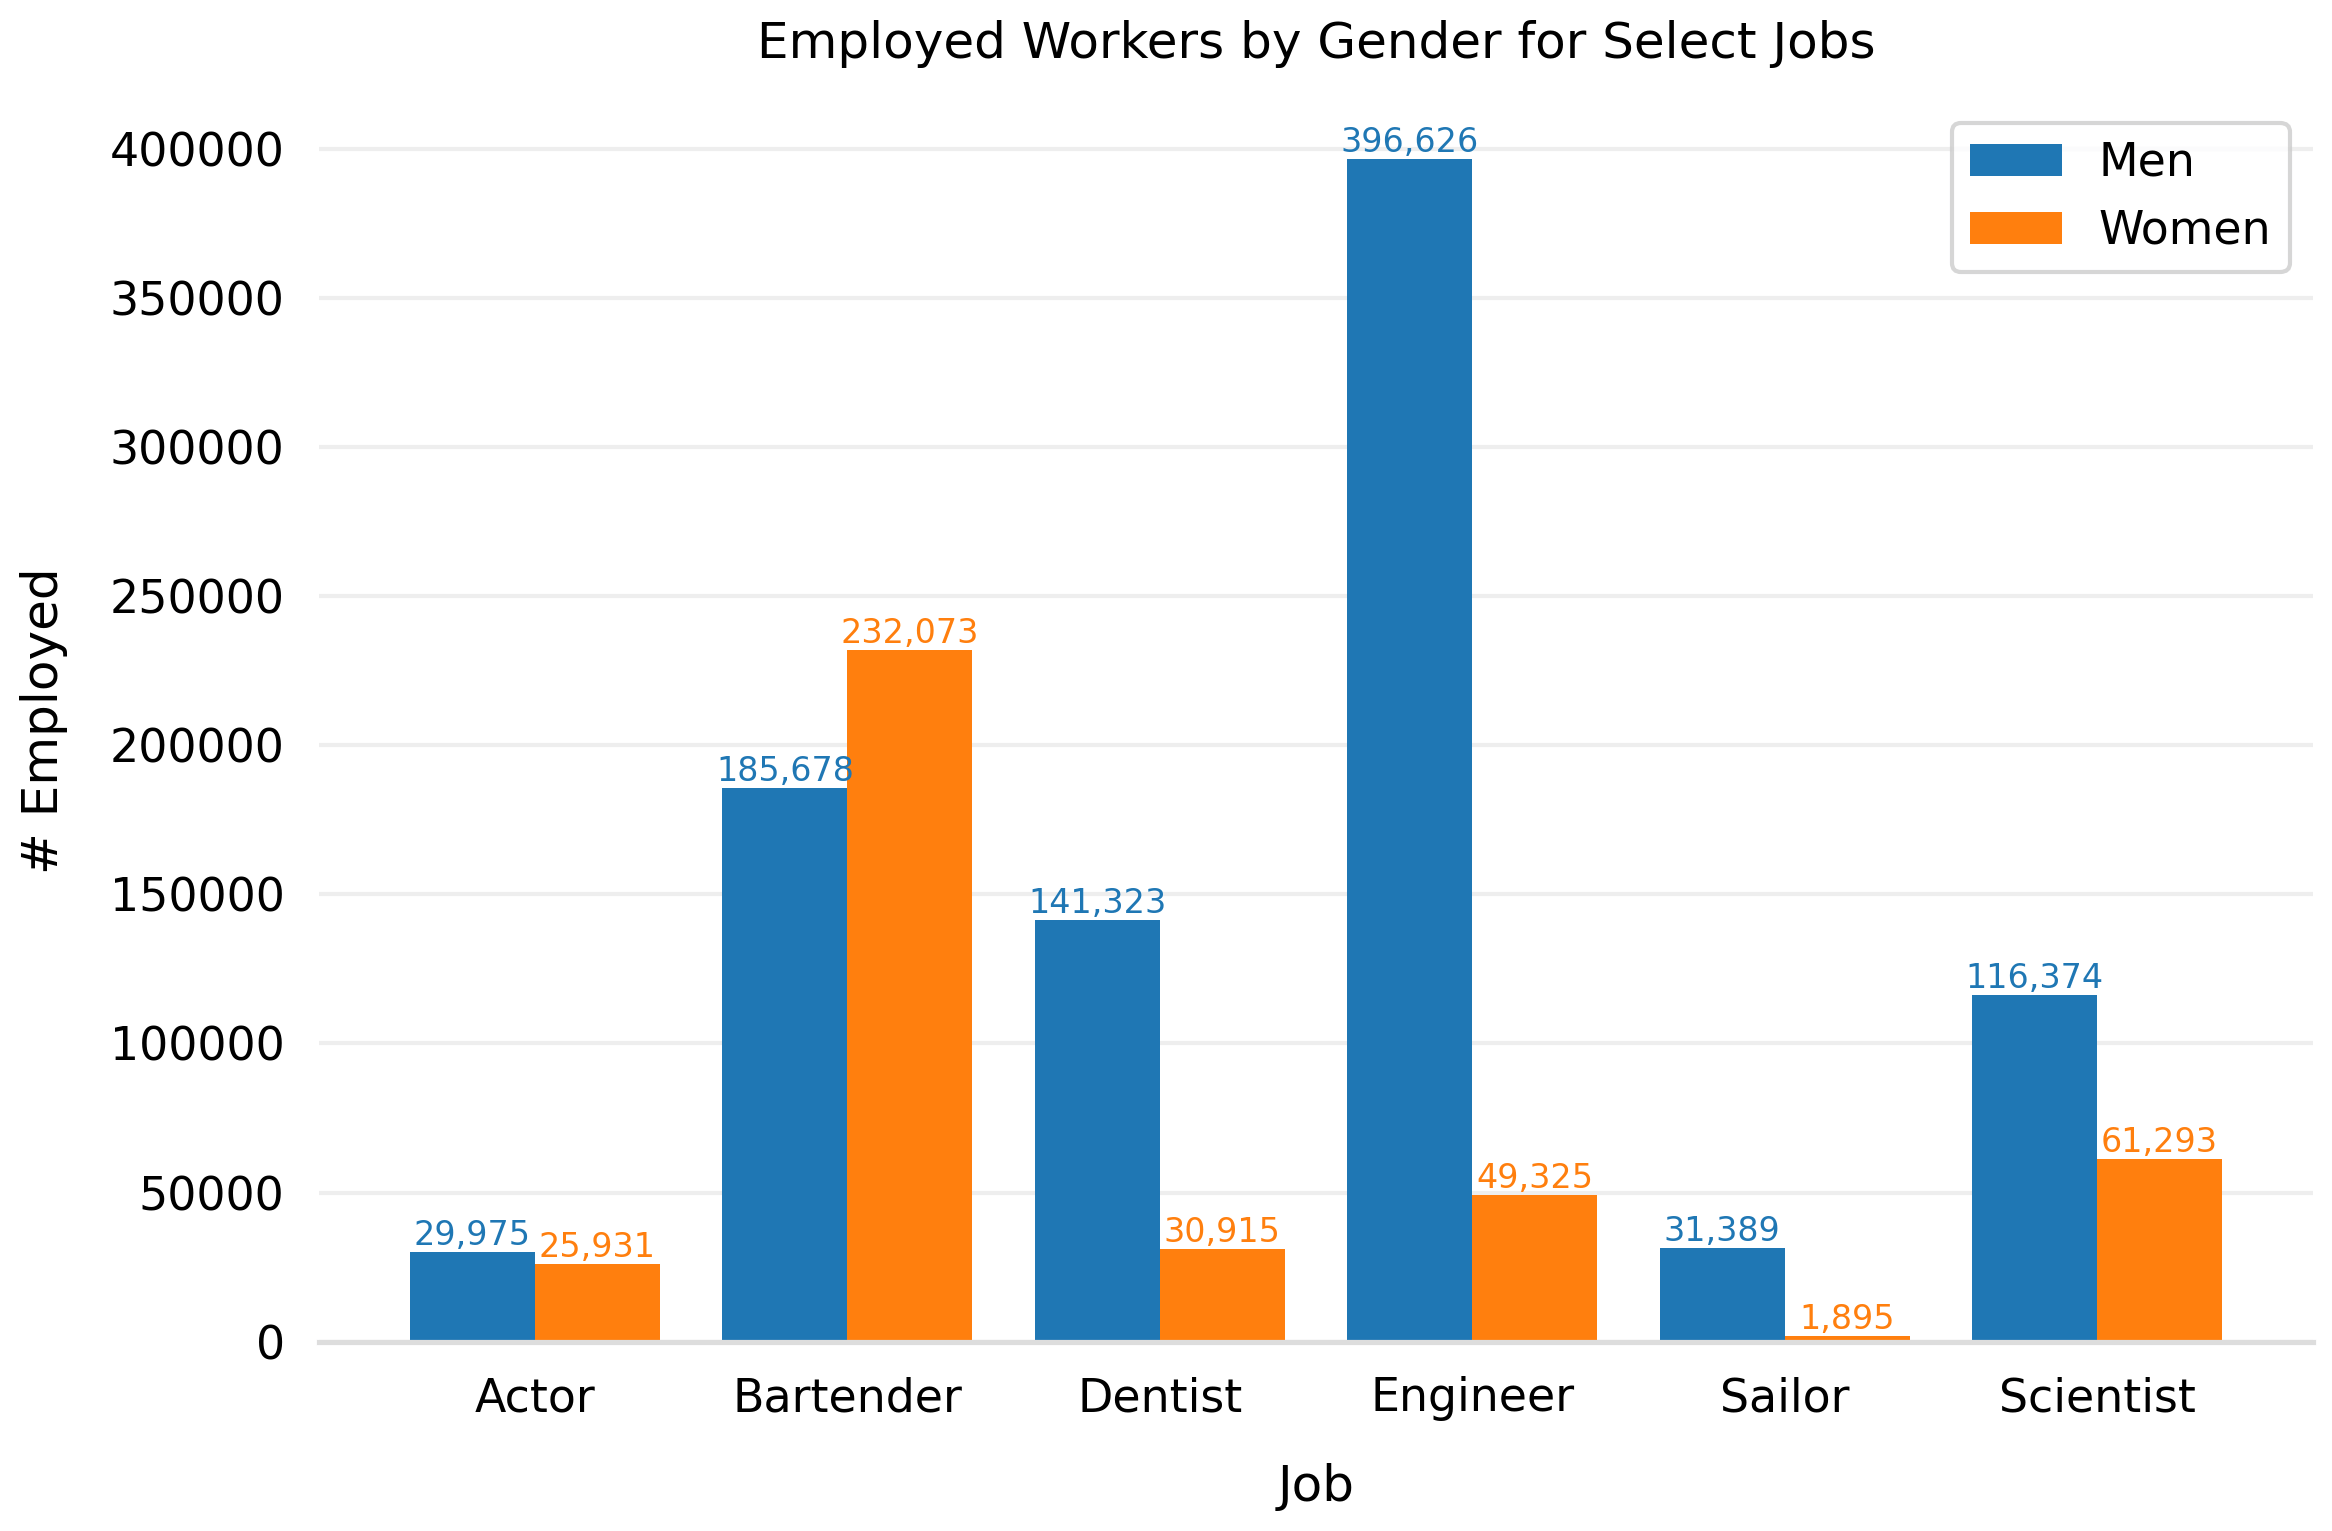
A few examples of how to create grouped bar charts (with labels) in Matplotlib
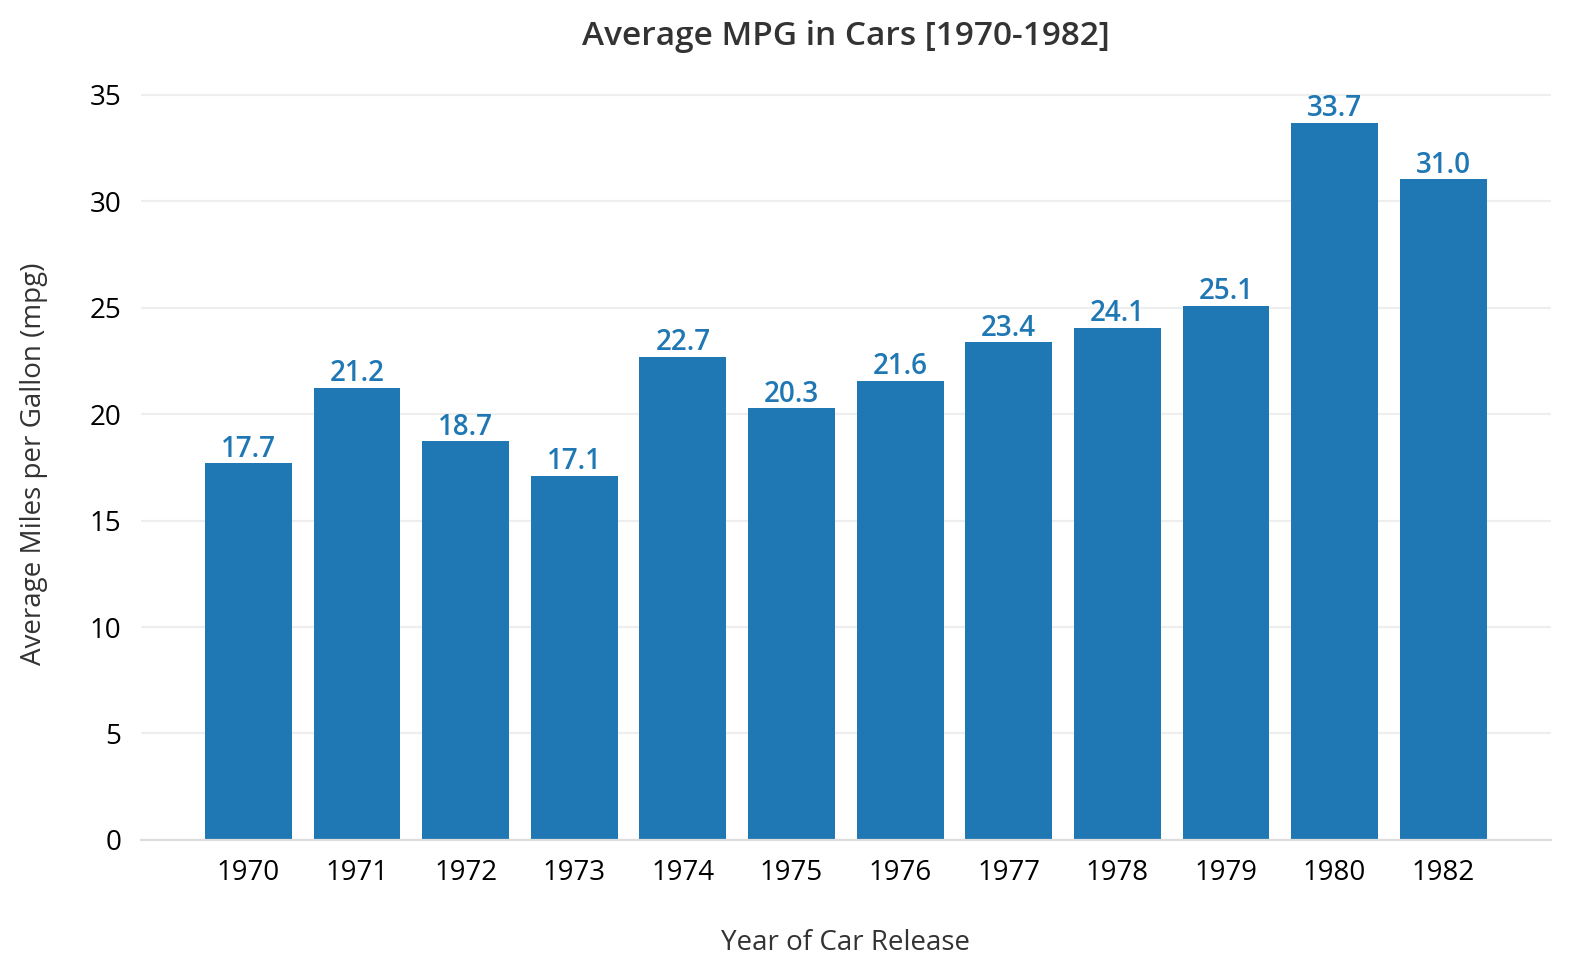
Transforming the default Matplotlib bar chart into a simple, stylish visualization