
Pandas
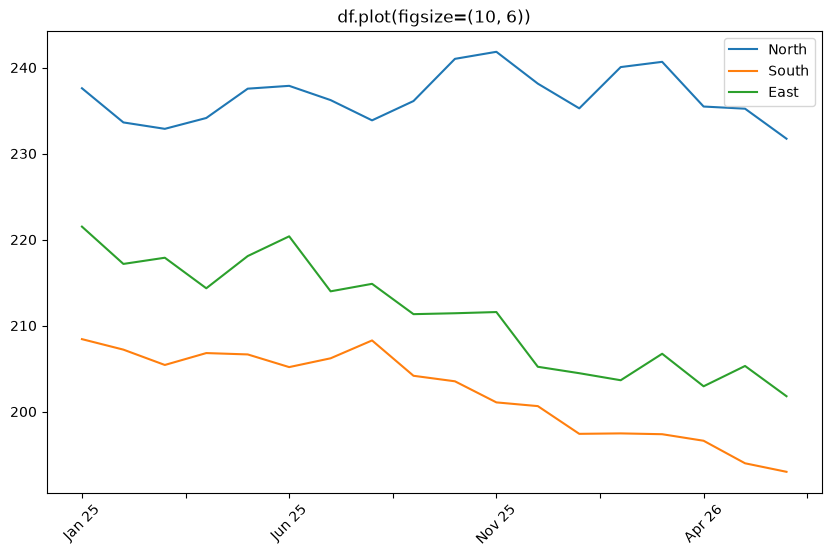
Change Figure Size when using df.plot() in Pandas
Change the figure size for Pandas df.plot() charts with figsize, plt.subplots, and rcParams.
Change the figure size for Pandas df.plot() charts with figsize, plt.subplots, and rcParams.
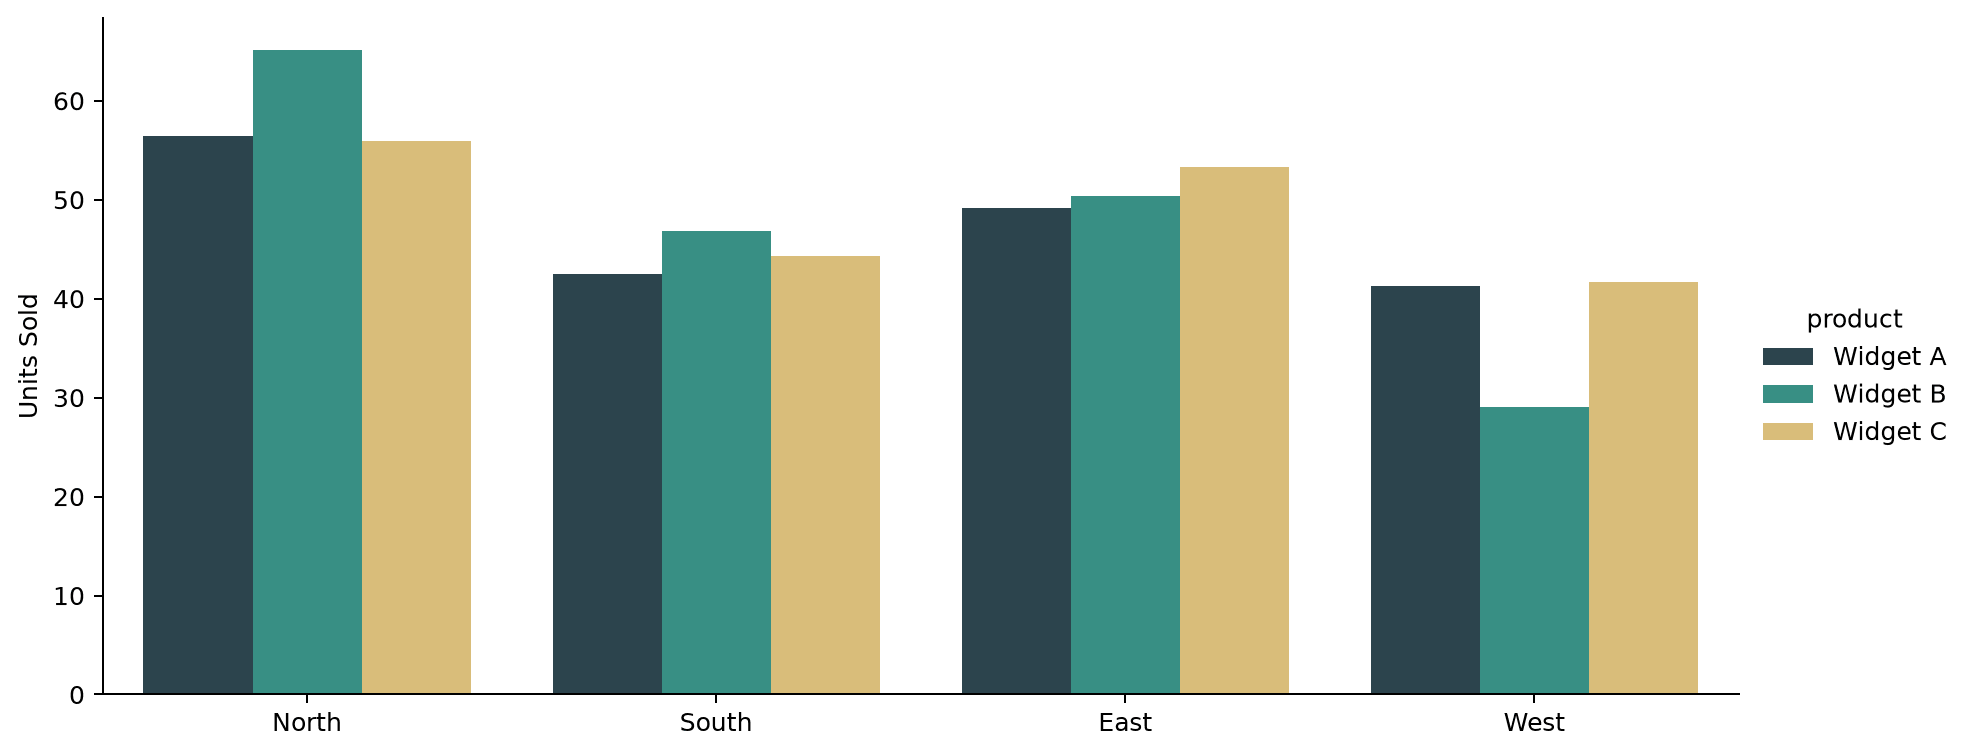
Control the size and shape of a Seaborn catplot using its height and aspect arguments instead of figsize.

How to change the figure and plot size in Matplotlib