
Altair
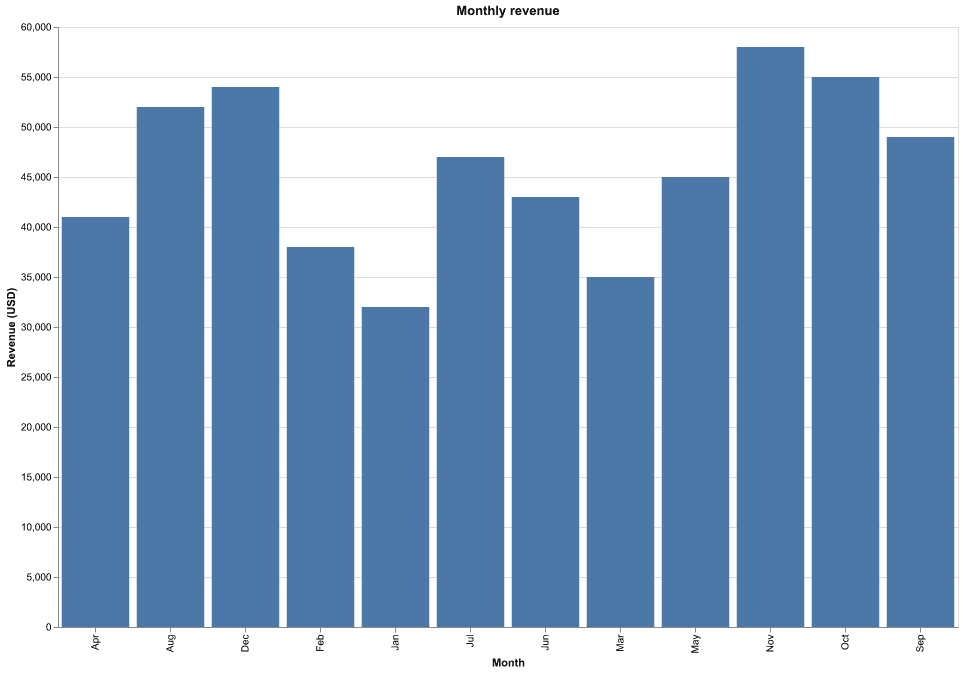
Set Custom Axis Titles and Formatting in Altair
Set custom axis titles and number formatting in Altair with alt.X, alt.Y, and alt.Axis.
Set custom axis titles and number formatting in Altair with alt.X, alt.Y, and alt.Axis.
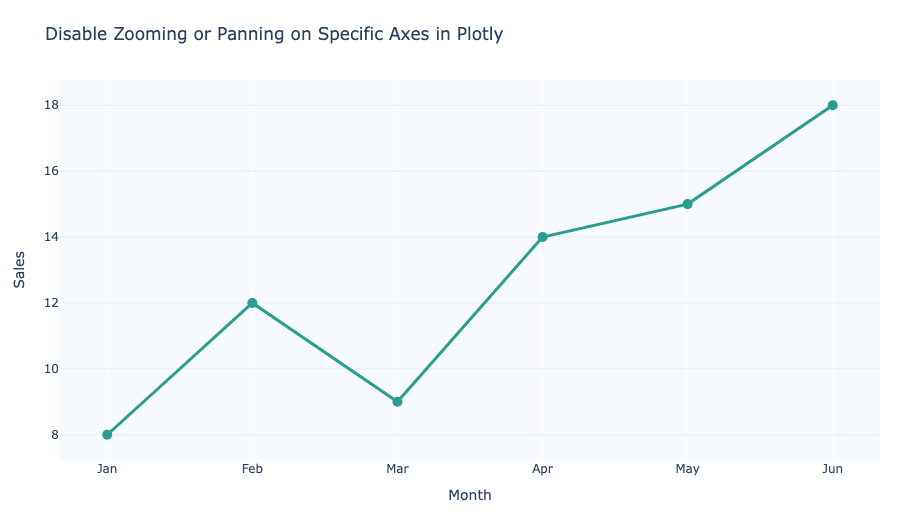
Disable zooming or panning on individual Plotly axes using fixedrange, dragmode, and axis settings.
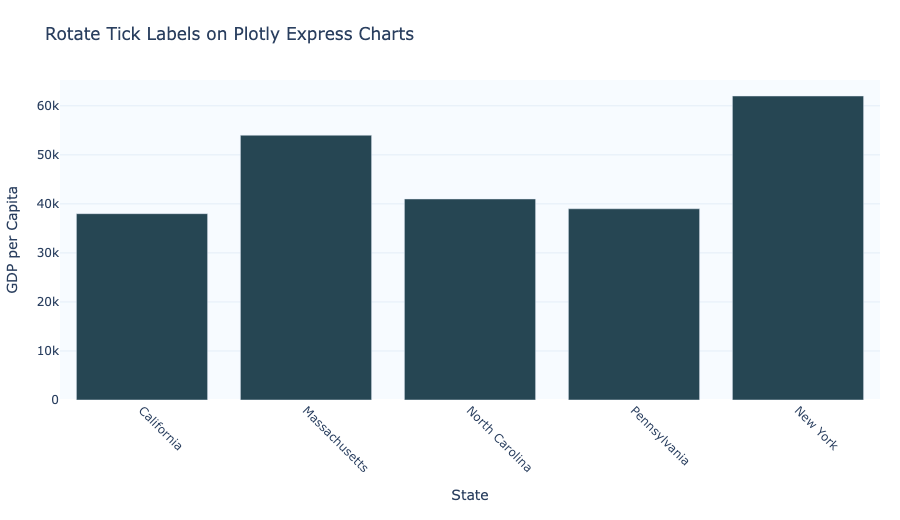
Rotate tick labels in Plotly Express charts to keep axis values readable and avoid overlap.
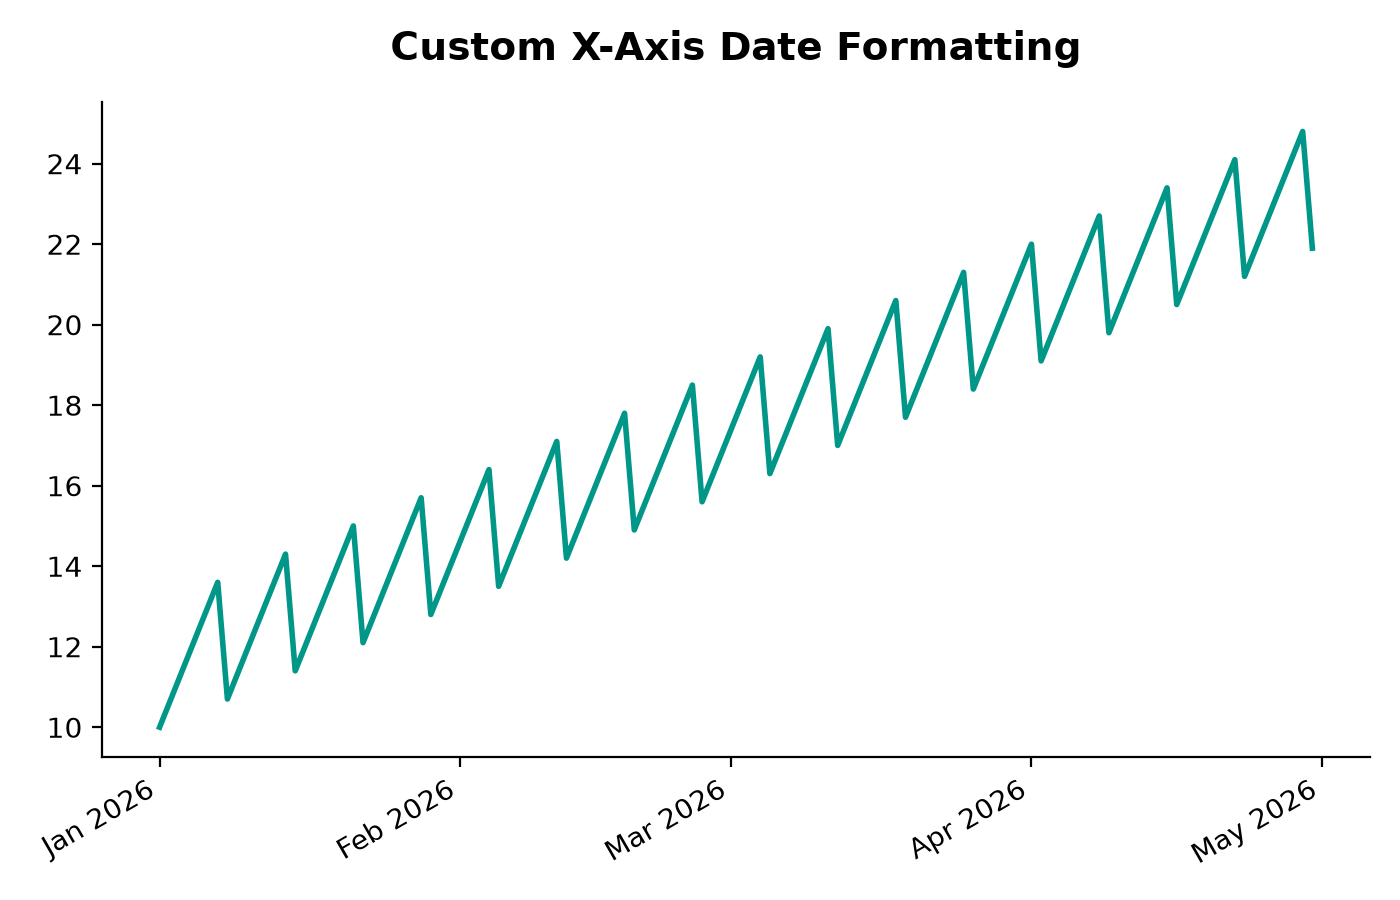
Quick tutorial on formatting date axis labels in Matplotlib using mdates.DateFormatter and MonthLocator.
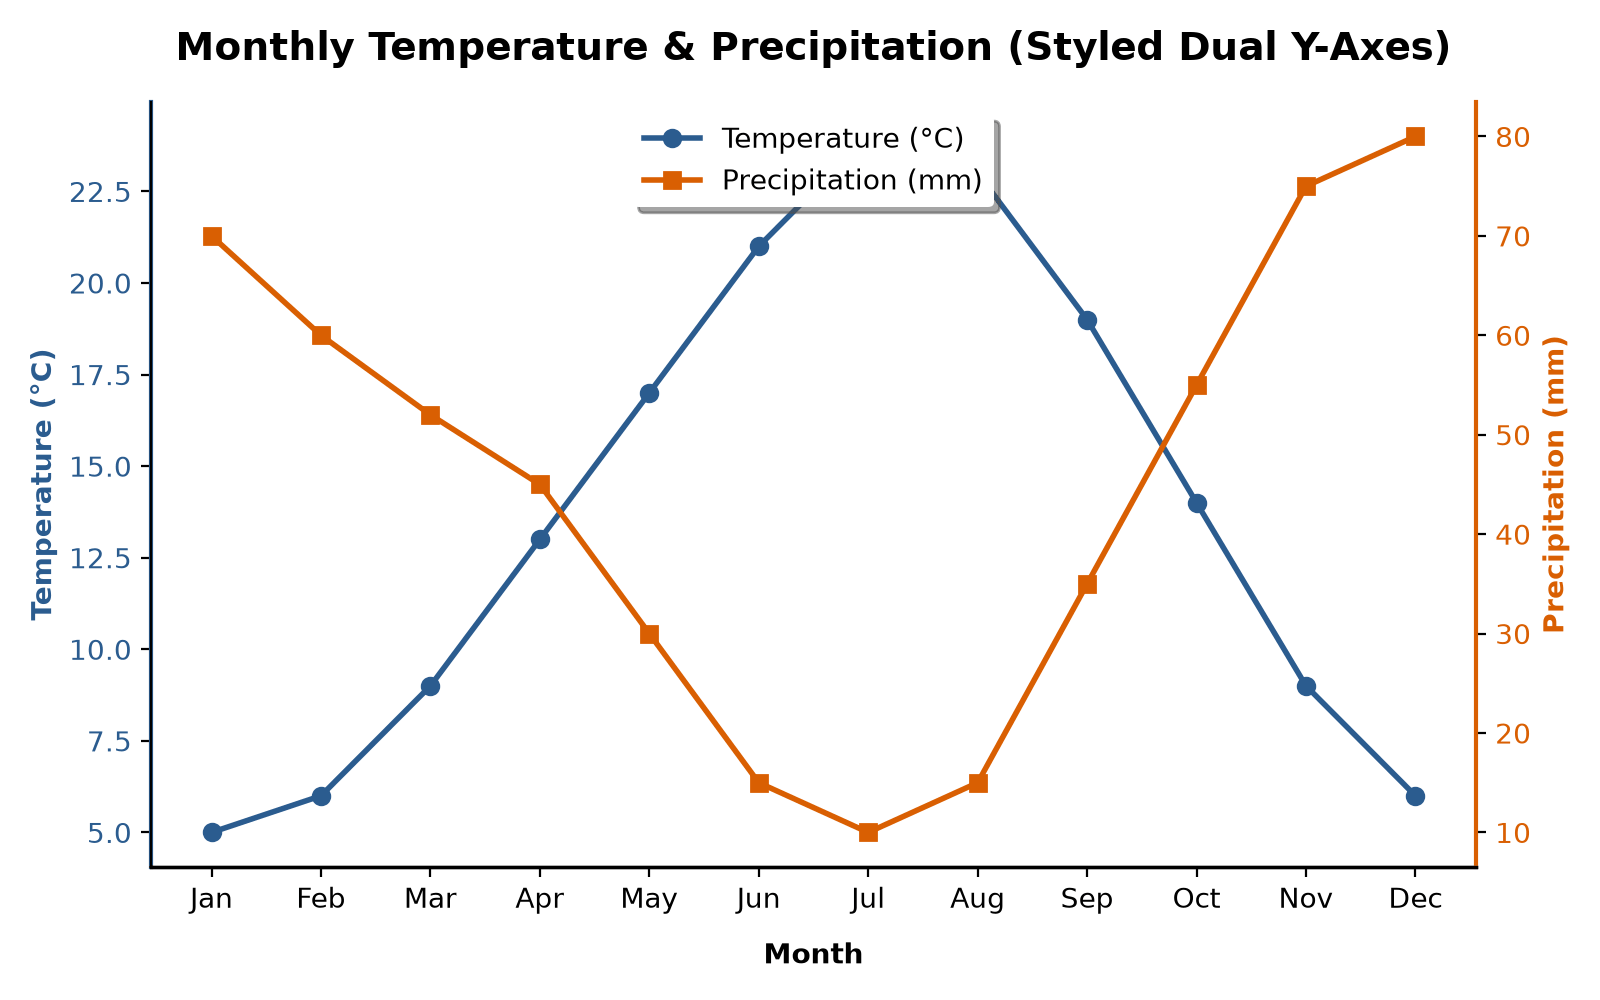
Learn how to use ax.twinx() to plot two datasets with different scales on a shared X-axis.

A look at all the ways you can rotate axis labels in Matplotlib