
Altair
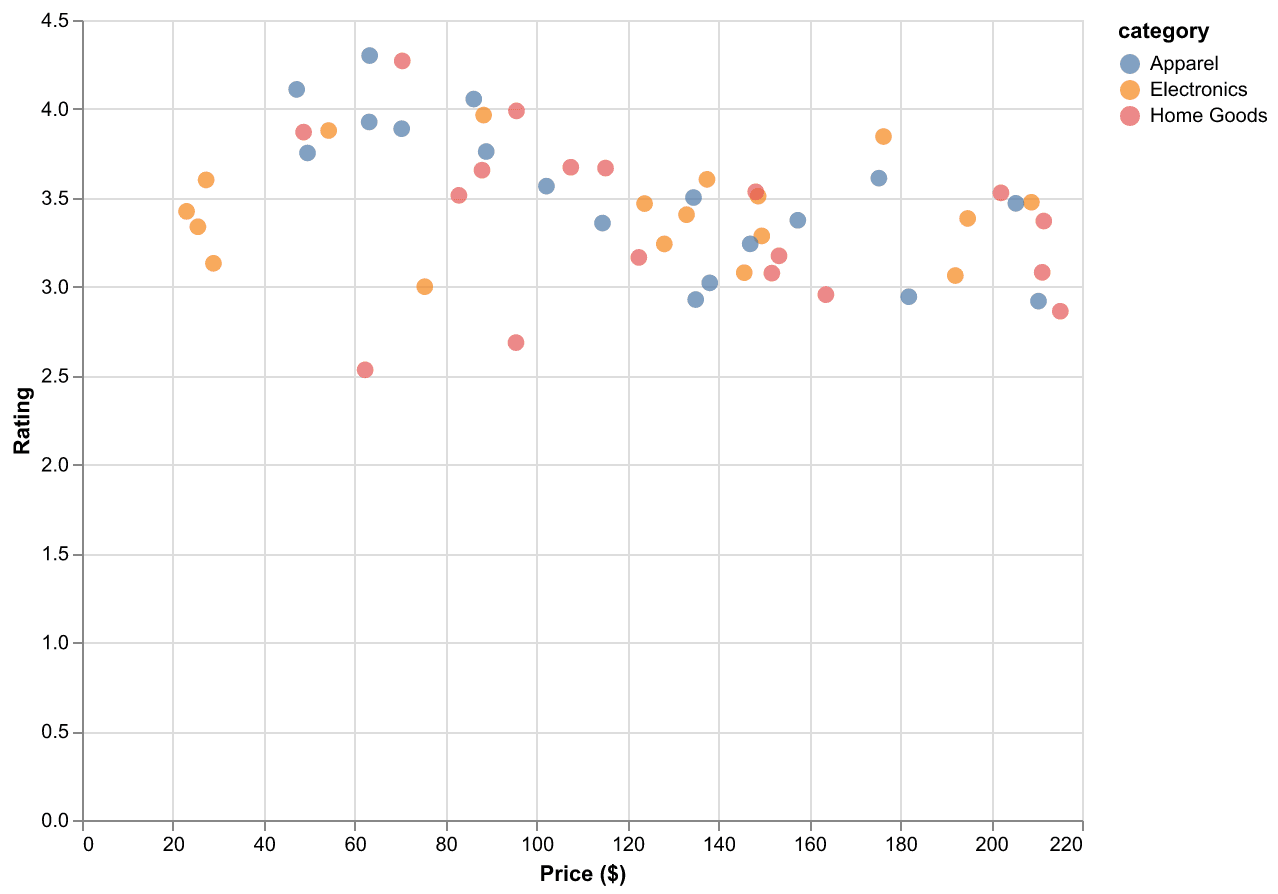
Add Interactive Tooltips to Altair Scatter Plots
Add and customize hover tooltips on Altair scatter plots, including formatting values and showing computed fields.
Add and customize hover tooltips on Altair scatter plots, including formatting values and showing computed fields.
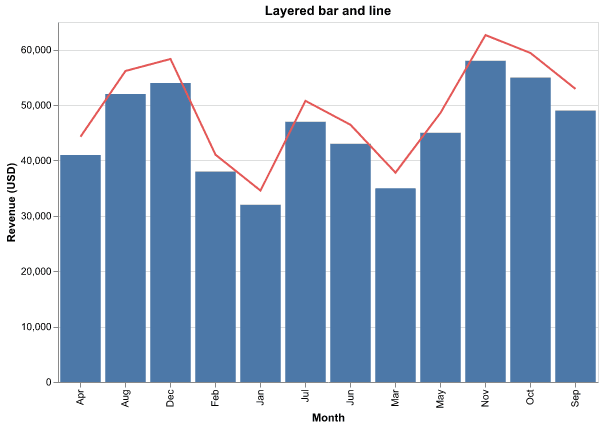
Combine multiple Altair charts with layering (operator +) and concatenation (| and &).
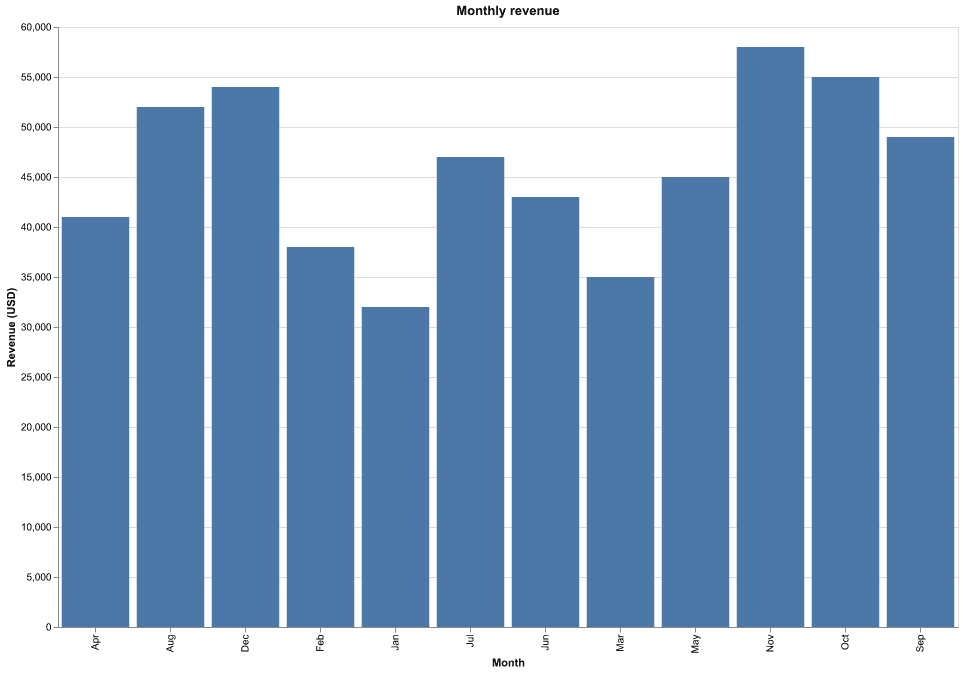
Set custom axis titles and number formatting in Altair with alt.X, alt.Y, and alt.Axis.
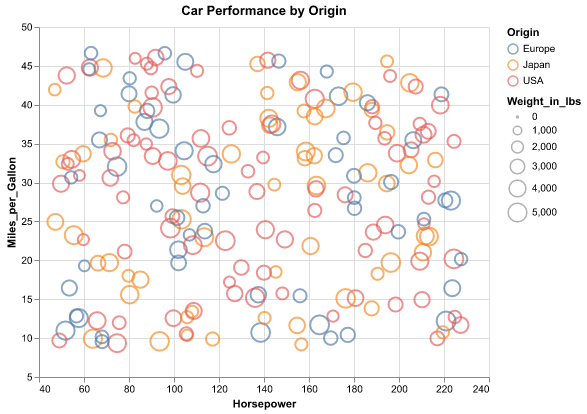
Learn how to save and export Altair charts in multiple formats including PNG, SVG, and HTML

Using Matplotlib, Seaborn, Altair and Plotly to create a line chart with a confidence interval

A complete guide to creating stacked bar charts in python using Pandas, Matplotlib, Seaborn, Plotnine and Altair
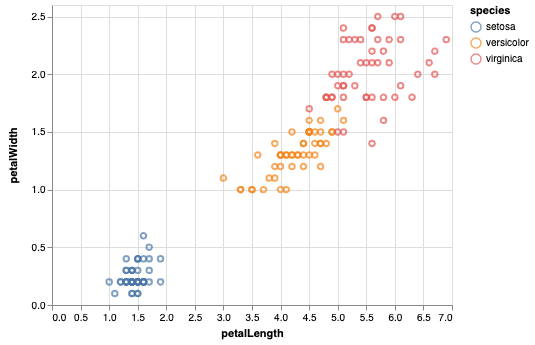
A brief introduction to the Altair Python visualization library